Sersic1D
-
class
astropy.modeling.functional_models.Sersic1D(amplitude=1, r_eff=1, n=4, **kwargs)[source] [edit on github]¶ Bases:
astropy.modeling.Fittable1DModelOne dimensional Sersic surface brightness profile.
Parameters: - amplitude : float
Surface brightness at r_eff.
- r_eff : float
Effective (half-light) radius
- n : float
Sersic Index.
Other Parameters: - fixed : a dict, optional
A dictionary
{parameter_name: boolean}of parameters to not be varied during fitting. True means the parameter is held fixed. Alternatively thefixedproperty of a parameter may be used.- tied : dict, optional
A dictionary
{parameter_name: callable}of parameters which are linked to some other parameter. The dictionary values are callables providing the linking relationship. Alternatively thetiedproperty of a parameter may be used.- bounds : dict, optional
A dictionary
{parameter_name: value}of lower and upper bounds of parameters. Keys are parameter names. Values are a list or a tuple of length 2 giving the desired range for the parameter. Alternatively, theminandmaxproperties of a parameter may be used.- eqcons : list, optional
A list of functions of length
nsuch thateqcons[j](x0,*args) == 0.0in a successfully optimized problem.- ineqcons : list, optional
A list of functions of length
nsuch thatieqcons[j](x0,*args) >= 0.0is a successfully optimized problem.
See also
Notes
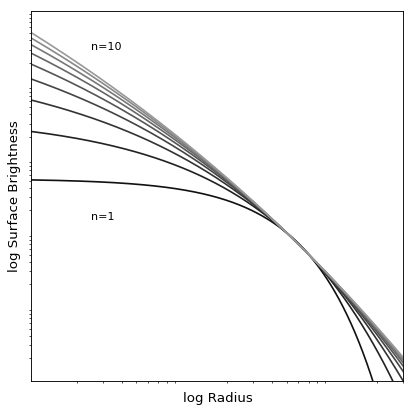
Model formula:
\[I(r)=I_e\exp\left\{-b_n\left[\left(\frac{r}{r_{e}}\right)^{(1/n)}-1\right]\right\}\]The constant \(b_n\) is defined such that \(r_e\) contains half the total luminosity, and can be solved for numerically.
\[\Gamma(2n) = 2\gamma (b_n,2n)\]References
[1] http://ned.ipac.caltech.edu/level5/March05/Graham/Graham2.html Examples
import numpy as np
from astropy.modeling.models import Sersic1D
import matplotlib.pyplot as plt

plt.figure()
plt.subplot(111, xscale='log', yscale='log')
s1 = Sersic1D(amplitude=1, r_eff=5)
r=np.arange(0, 100, .01)

for n in range(1, 10):
     s1.n = n
     plt.plot(r, s1(r), color=str(float(n) / 15))

plt.axis([1e-1, 30, 1e-2, 1e3])
plt.xlabel('log Radius')
plt.ylabel('log Surface Brightness')
plt.text(.25, 1.5, 'n=1')
plt.text(.25, 300, 'n=10')
plt.xticks([])
plt.yticks([])
plt.show()
()
Attributes Summary
amplitudeinput_unitsThis property is used to indicate what units or sets of units the evaluate method expects, and returns a dictionary mapping inputs to units (or Noneif any units are accepted).nparam_namesr_effMethods Summary
evaluate(r, amplitude, r_eff, n)One dimensional Sersic profile function. Attributes Documentation
-
amplitude
-
input_units¶ This property is used to indicate what units or sets of units the evaluate method expects, and returns a dictionary mapping inputs to units (or
Noneif any units are accepted).Model sub-classes can also use function annotations in evaluate to indicate valid input units, in which case this property should not be overridden since it will return the input units based on the annotations.
-
n
-
param_names= ('amplitude', 'r_eff', 'n')
-
r_eff
Methods Documentation
-
classmethod
evaluate(r, amplitude, r_eff, n)[source] [edit on github]¶ One dimensional Sersic profile function.